Analytics
The analytics overview shows your messages, your conversations, how fast your team replies, and when customers write.
ImplementedWorks in the app today, as this page describes.
Last reviewed against the app on
Analytics shows how your messages and conversations are doing. Every figure says when it was last worked out.
Who can do this: Everyone
Owners, Admins and Managers see the whole team. Agents see their own performance only ('You're seeing your own numbers').
Steps
Open Analytics from the sidebar. The Overview tab opens.
Choose the time range: 7 days, 30 days or 90 days. Each figure is compared with the same length of time before it.
Use the tabs for Campaign reports, Usage and cost, and exports.
What the overview shows
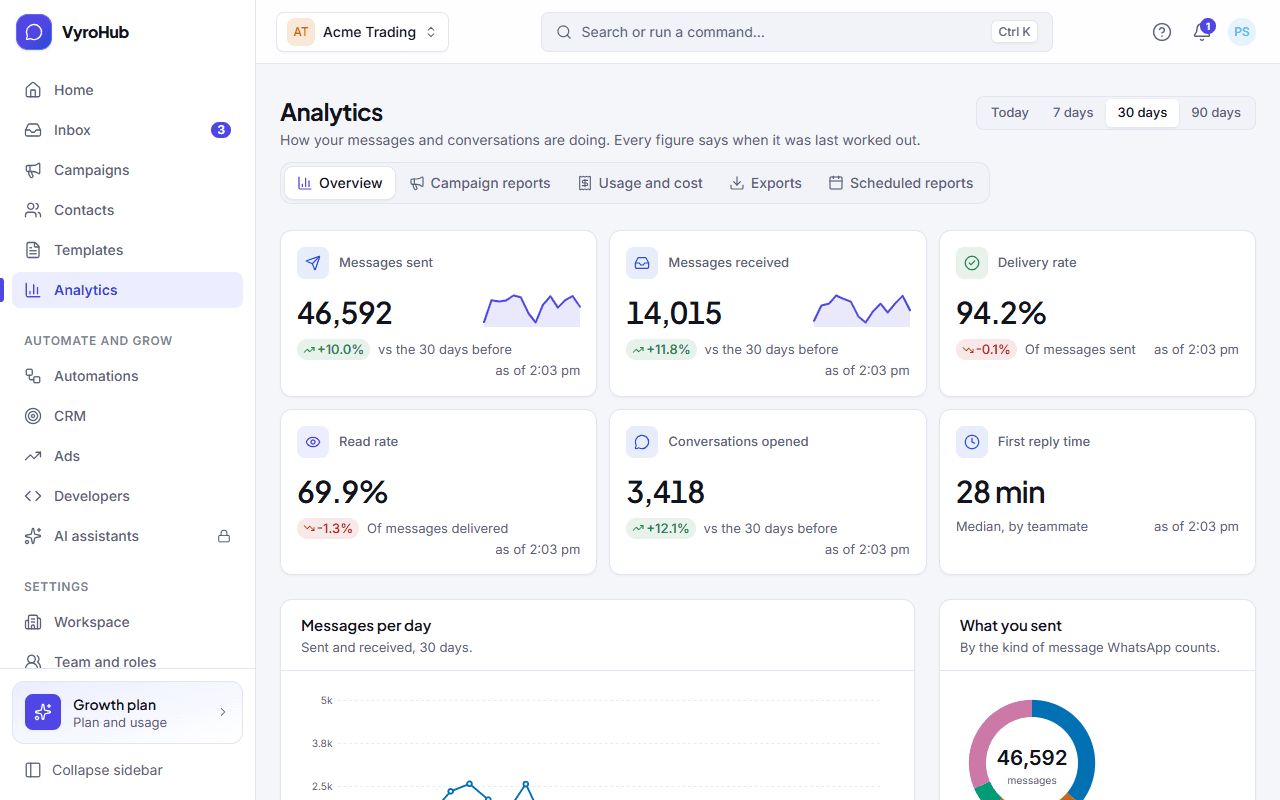
| Part | What it shows |
|---|---|
| Key figures | Messages sent, messages received, delivery rate, read rate, conversations opened, conversations resolved, first reply time, and time to resolve. Each shows the change against the period before; for reply and resolve times, down is good. |
| Messages per day | Sent and received, per day, for the range. |
| What you sent | Your messages by the kind WhatsApp counts them in: Marketing, Updates, One-time codes, and replies to customers. |
| Workload by teammate | Who is holding what right now ("Open now", "Customer waiting") and how quickly each person first replies. |
| When customers write | Customer messages by weekday and hour, in India time. Useful for planning who is on shift. |
When it works
The figures fill in once you've sent or received messages, with an "as of" time.
When something goes wrong
| What you see | Why | What to do |
|---|---|---|
| "No data yet" | Nothing sent or received yet. | Connect a number and message a contact to get started. |
| "Nobody has conversations yet" in Workload | Nothing is assigned. | Assigned conversations show up here. |
| "We couldn't load your analytics" | A short connection problem. | Choose retry. |
| "You can't see analytics" | Your role can't. | Ask an Owner, Admin or Manager. |
| Figures look a little behind | Figures are worked out regularly, not every second. | Check the "as of" time. |
Limits
| Limit | Value | Set by |
|---|---|---|
| Time ranges | 7, 30 or 90 days | VyroHub |
| Agents | See only their own figures | VyroHub |
More in Analytics
Campaign reports
Compare your campaigns side by side.
Usage and cost
What you sent and roughly what Meta will charge.
Exports
Download reports as files.
Having a report emailed to you on a schedule, such as every Monday morning.